Injected current
Change neuronal input and examine membrane potential, threshold, firing and adaptation.
OPEN-SOURCE NEUROSCIENCE EDUCATION
Spikeling combines interactive hardware, a real-time spiking-neuron model and desktop software to bring neurophysiology experiments into the classroom.
Students can investigate neuronal dynamics through hands-on experiments, while connecting physical manipulation, electrophysiology-style recording and neural data analysis.
What is Spikeling ?
Spikeling brings together physical interaction, a real-time computational neuron and software for visualisation and recording.
Students can manipulate inputs, observe how neuronal activity changes, and work with the resulting signals as experimental data.
Students interact with Spikeling through physical controls, sensory inputs, stimulation and synaptic connections.
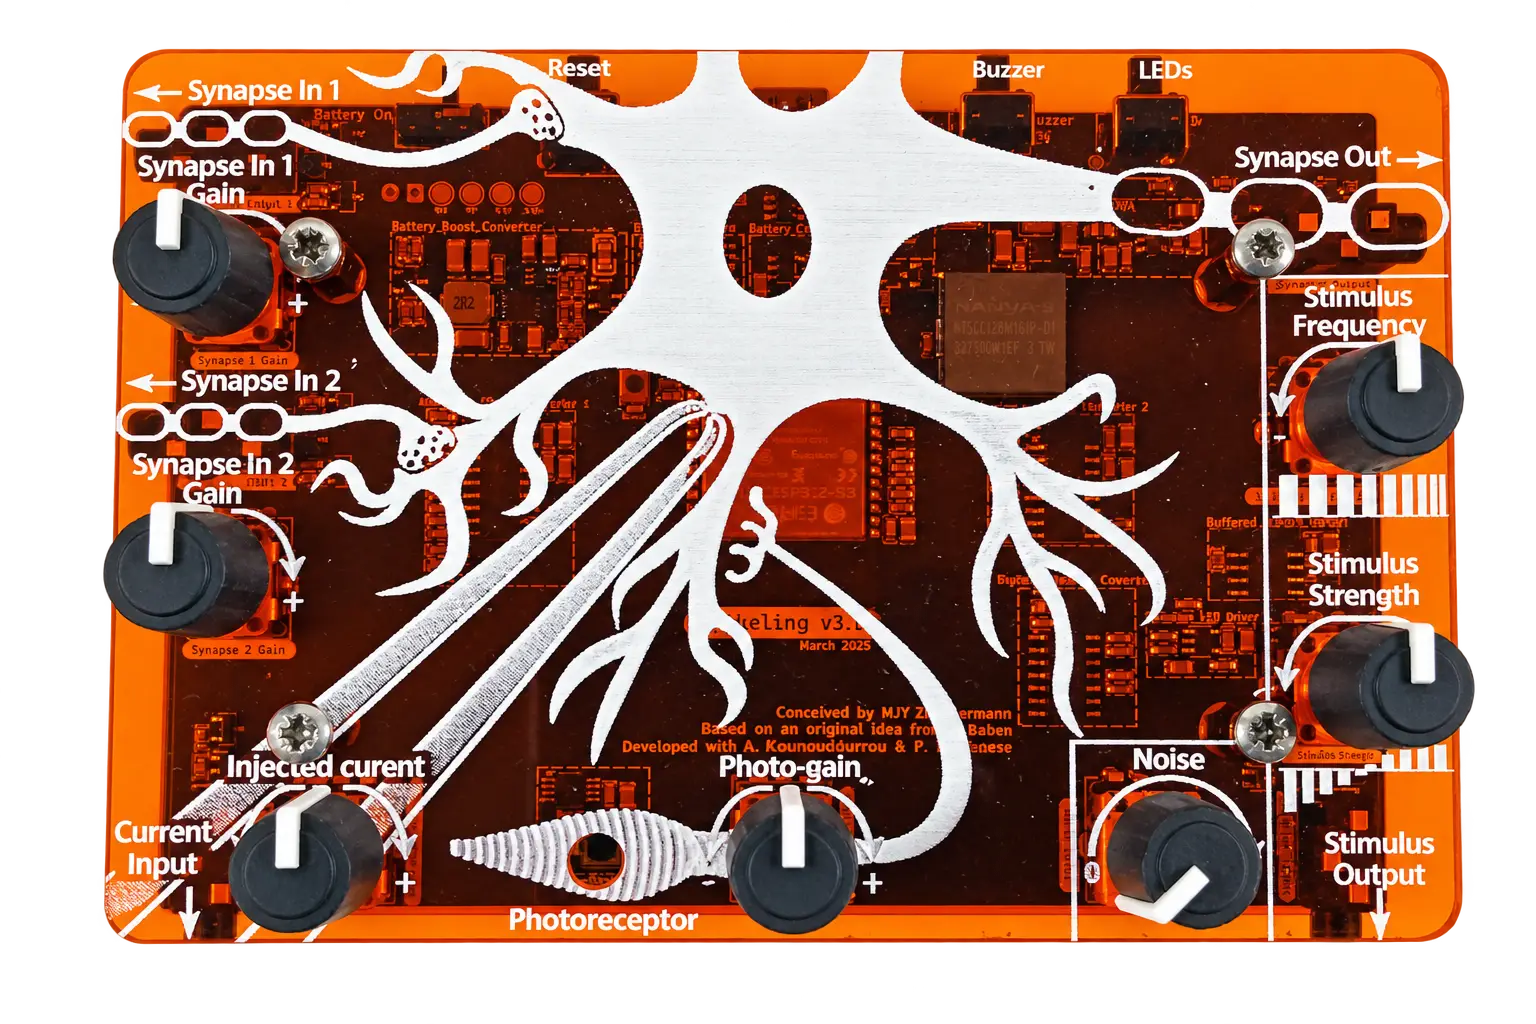
Inputs are integrated by a real-time Izhikevich spiking-neuron model, producing membrane-potential dynamics and spike output that respond continuously to experimental manipulation.
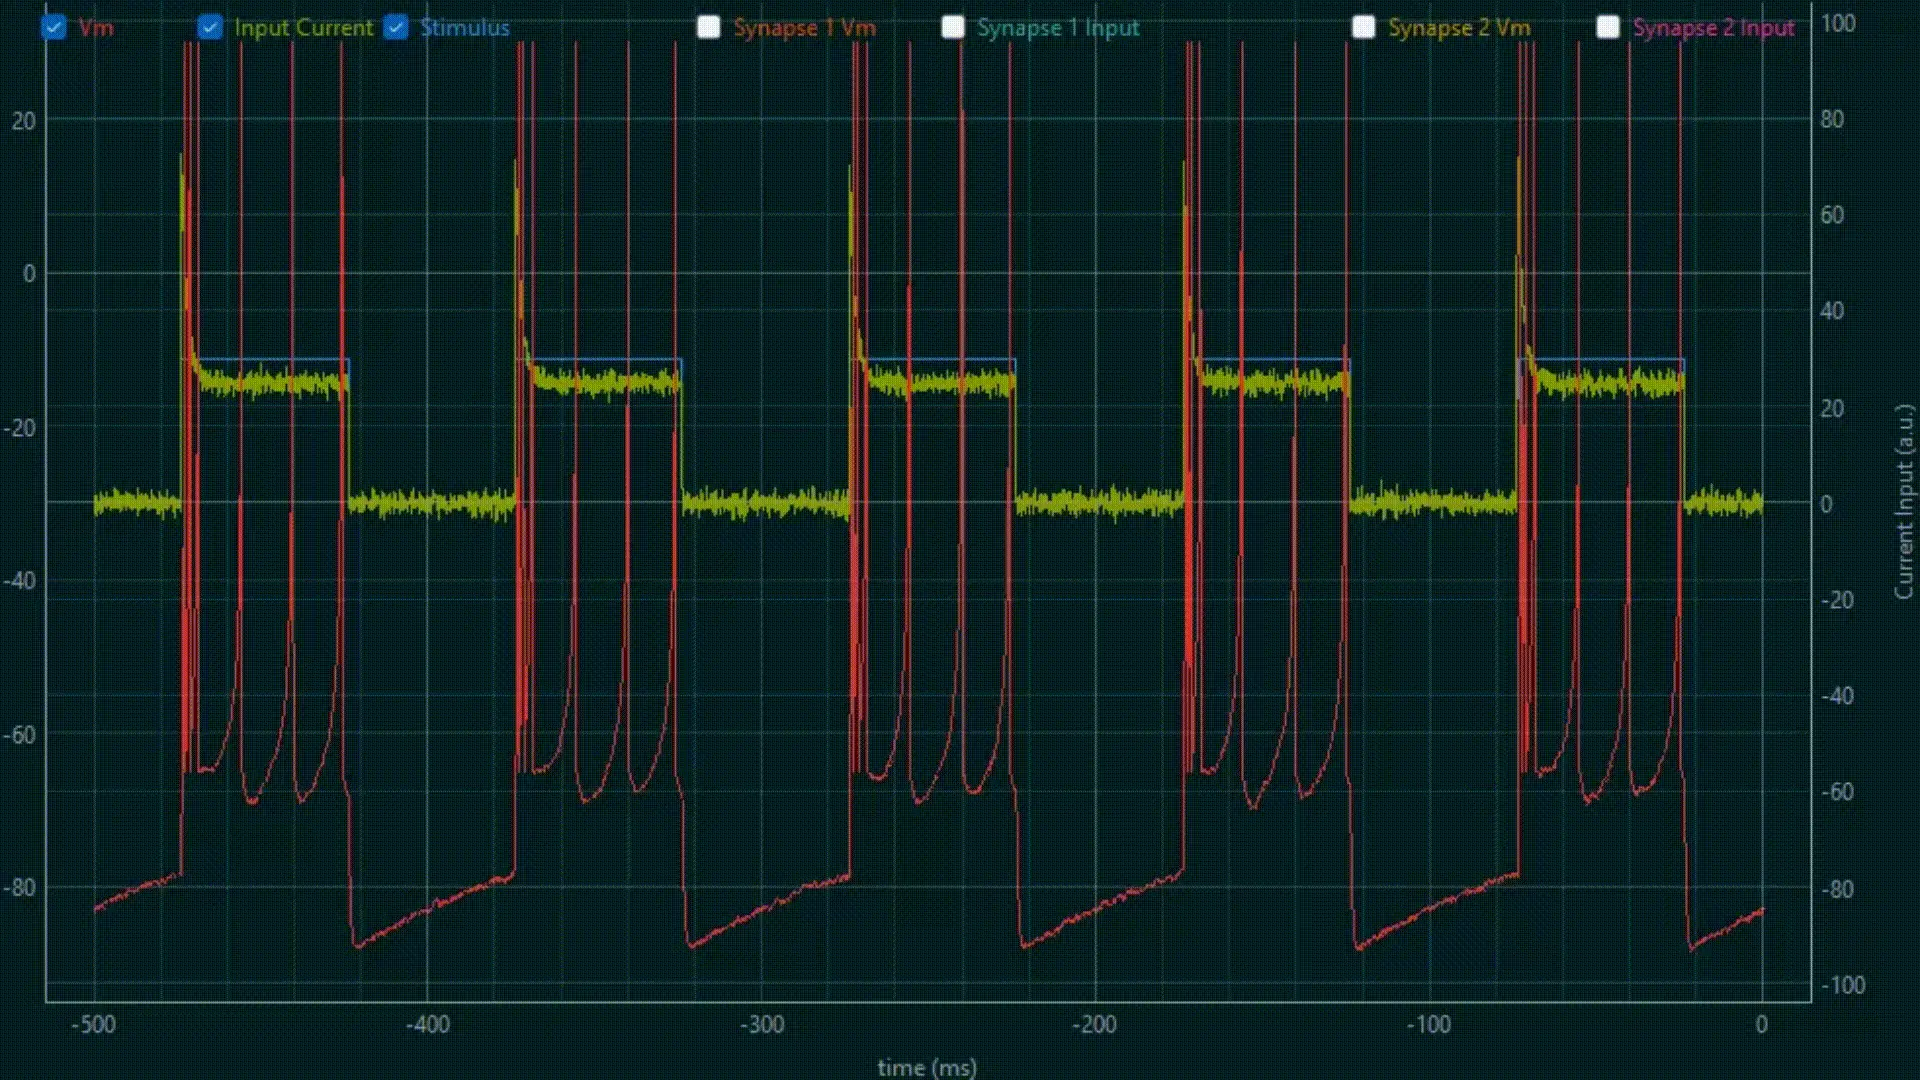
The desktop software displays neuronal activity live, supports experimental workflows and provides recorded signals that can be used for interpretation and analysis.
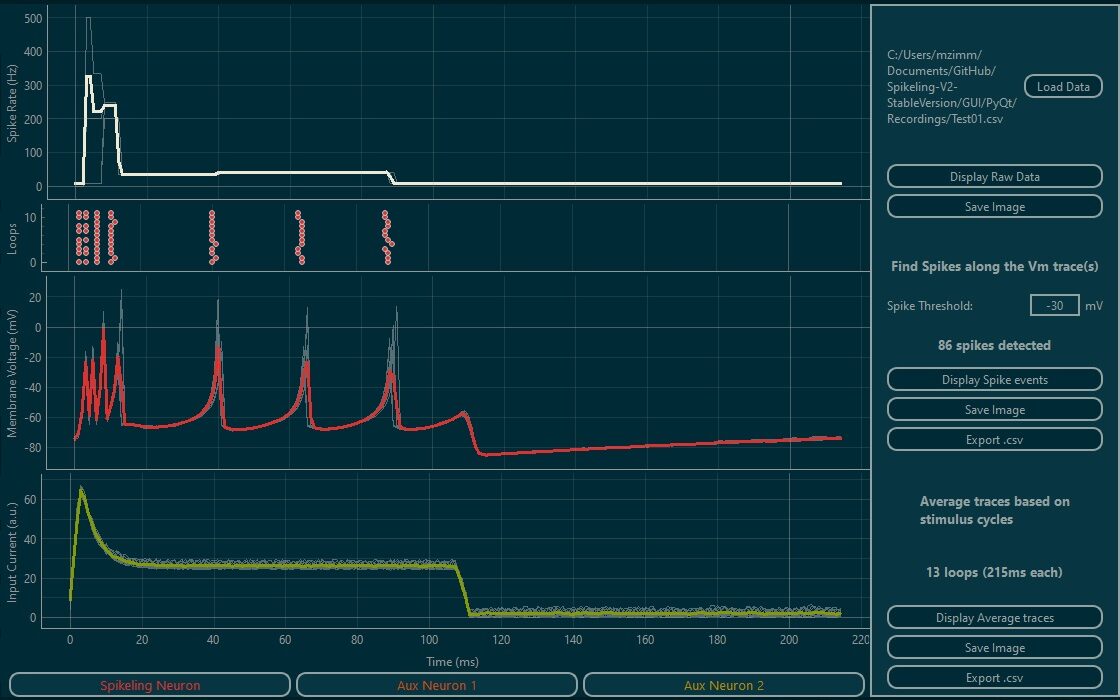
The same underlying neuronal activity can therefore be manipulated physically, observed through different experimental representations and examined quantitatively.
Educational scope: Spikeling uses a computational neuron and simplified experimental representations to teach the logic of neuronal experimentation and measurement. It does not reproduce the full biological or instrumental complexity of the corresponding research methods.
experiment with the neuron
Spikeling lets students manipulate a computational neuron under controlled conditions and observe how its behaviour changes.
Each interaction is designed to connect manipulation, observation and interpretation rather than present neuronal behaviour as a fixed demonstration.
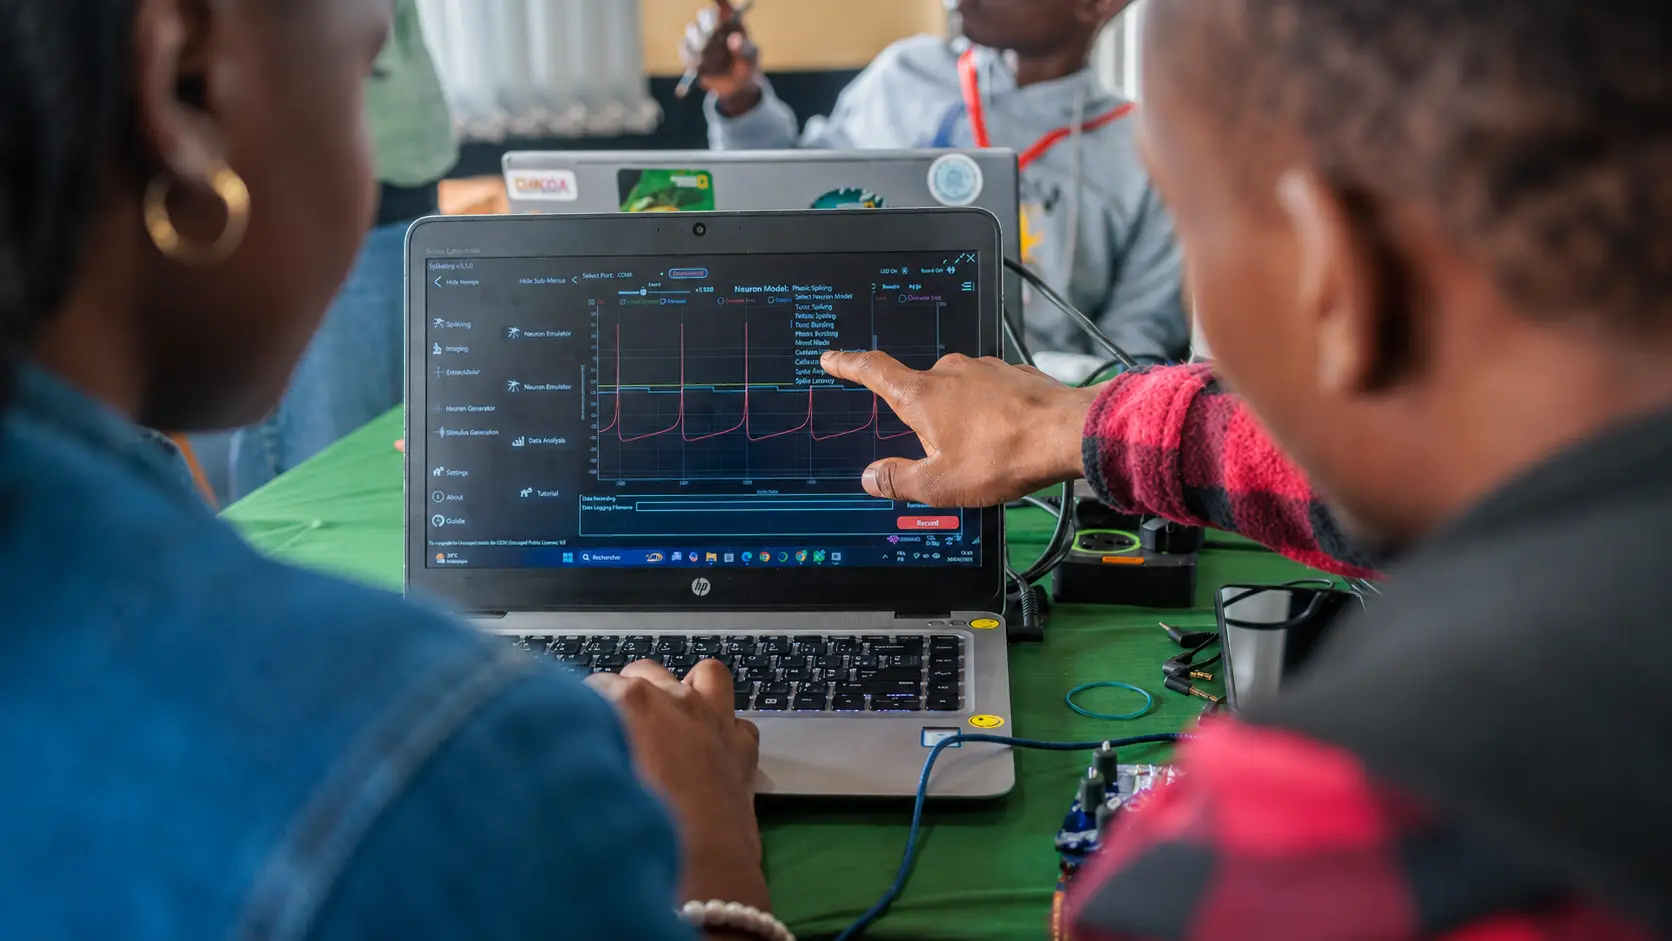
Change neuronal input and examine membrane potential, threshold, firing and adaptation.
Vary stimulus strength, timing and repetition to test stimulus–response relationships.
Add controlled noise and compare response reliability across repeated trials.
Use the photoreceptor to relate changes in illumination to neuronal response.
Connect neurons to investigate excitation, inhibition and simple circuit interactions.
Electrophysiology-style interaction
Spikeling recreates the experimental logic of electrophysiology by giving students direct control over the input applied to a computational neuron while displaying its membrane potential and spike output continuously.
Using the physical controls or the desktop interface, they can depolarise or hyperpolarise the neuron, apply controlled current inputs, and observe in real time how its electrical state changes.
Because the input and neuronal response are visible together, students can move beyond simply recognising an action potential and investigate how excitability is measured experimentally.
They can identify the transition from subthreshold responses to spiking, examine how firing rate changes with input, compare different neuronal firing modes under the same conditions, and observe phenomena such as latency, adaptation, bursting and rebound responses.
What students investigate
How changes in input alter membrane potential, firing threshold, firing frequency and response dynamics across different model behaviours.
Current-clamp · Voltage-clamp · Membrane potential · Threshold · Excitability · Firing patterns · Adaptation
TEACHING SCOPE & LIMITS
Spikeling reproduces the experimental logic of manipulating an input and observing a neuronal response, but the membrane potential is generated by a computational model.
The system does not reproduce a biological membrane, ion-channel dynamics or a research electrophysiology recording chain.
PROTOCOL DESIGN
The physical Spikeling provides an immediate square-wave stimulus for rapid experiments, while the desktop GUI extends stimulation into a flexible protocol-design environment.
Students can construct, preview and apply structured waveforms to test specific questions about neuronal excitability, temporal integration, adaptation, resonance and response reliability.
From current steps and step families to oscillatory inputs, frequency sweeps and custom protocols, the stimulus becomes an experimental variable that students design rather than simply switch on.
Protocols are not limited to the presets: user-defined stimuli can be imported, allowing teaching activities to progress from standard recipes toward student-designed experiments.
What students investigate
How stimulus waveform, amplitude, duration, timing and repetition determine what can be learned from a neuronal response
How a protocol should be chosen to test a particular hypothesis.
Threshold · F–I relationships · Adaptation · Temporal integration · Resonance · Frequency following · Reliability
TEACHING SCOPE & LIMITS
Spikeling reproduces the logic of controlled stimulus design and stimulus–response experimentation.
The generated values are model/interface inputs and should not be interpreted automatically as calibrated biological current or as a complete representation of a research electrophysiology stimulator.
The educational focus is on protocol structure, controlled comparison and interpretation of the resulting neuronal response.
NOISE & VARIABILITY
Spikeling adds adjustable Gaussian noise to the input driving the neuron model. By keeping the neuron and stimulus protocol fixed while changing noise amplitude, students can repeat the same experiment and examine how reliably the neuron responds.
Near threshold, small fluctuations can determine whether and when a spike occurs, turning variability into something that can be measured rather than dismissed as an irregular trace.
Variability can influence what is observed, and experimental design determines whether that variability can be characterised.
What students investigate
How controlled stochastic input changes response probability, spike timing and trial-to-trial variability under otherwise matched experimental conditions.
Repeated trials · Spike probability · Latency jitter · Threshold variability · Response reliability
TEACHING SCOPE & LIMITS
Spikeling introduces a controlled Gaussian stochastic input to the computational neuron. This is useful for studying threshold crossings, response reliability and trial-to-trial variability, but it should not be treated as a complete model of biological or experimental noise.
Ion-channel fluctuations, stochastic synaptic activity, electrode and amplifier noise, environmental interference and acquisition artefacts have different origins and statistical properties.
Distinguishing these sources is itself an important part of the teaching.
SENSORY INPUT
Spikeling uses an on-board photodiode to convert changes in illumination into an input current driving the neuron model. Students can therefore move from a physical stimulus in the environment to changes in membrane potential and spiking activity.
Light can be delivered freely for exploratory demonstrations, or under controlled timing using an LED driven from the Spikeling stimulus output, allowing sensory-style protocols to be repeated and compared systematically.
The light-input pathway includes simplified decay and recovery dynamics, allowing students to explore adaptation-like changes during sustained or repeated stimulation.
What students investigate
How a physical stimulus is transformed into neuronal input, and how stimulus intensity, gain, polarity and temporal structure influence the resulting membrane-potential and spike response.
Sensory transduction · Stimulus–response · Gain & polarity · Dynamic range · Adaptation · Response reliability
TEACHING SCOPE & LIMITS
The photodiode provides a real physical light sensor, but the resulting current is an engineered input to the computational neuron.
This workflow can teach sensory transduction, stimulus–response relationships and adaptation-like dynamics, but it does not reproduce retinal phototransduction, photoreceptor membrane biophysics or a complete sensory pathway.
SYNAPSES & CONNECTIVITY
Spikeling units can be connected directly, allowing spikes generated by one neuron to become synaptic input to another.
A cable from the presynaptic axon output to a postsynaptic synapse input turns individual computational neurons into a simple physical network whose interactions can be manipulated and observed in real time.
Each incoming spike generates a transient, exponentially decaying synaptic current.
By changing the sign and strength of the synaptic gain, students can compare excitatory and inhibitory coupling, examine how repeated inputs summate over time, and determine when synaptic drive is sufficient to recruit, delay or suppress postsynaptic firing.
Because Spikeling provides two synaptic inputs, experiments can progress from a single connection to coincidence, competing excitation and inhibition, and simple network motifs, hence linking cellular excitability to the first principles of circuit behaviour.
What students investigate
How presynaptic spike timing, firing rate, synaptic sign and coupling strength determine postsynaptic membrane potential, spike recruitment and simple circuit behaviour.
Excitation & inhibition · Synaptic gain · Temporal summation · E/I balance · Coincidence detection · Network transfer
TEACHING SCOPE & LIMITS
Spikeling uses a simplified event-driven synapse: a presynaptic spike generates a decaying input current whose sign and magnitude are determined by synaptic gain. This supports experiments on excitation, inhibition, summation and elementary circuit behaviour, but it is not a biophysical model of synaptic transmission.
The system does not by itself reproduce neurotransmitter release, receptor kinetics, conductance-based reversal potentials, dendritic morphology or the molecular mechanisms of synaptic plasticity.
These distinctions should remain explicit when relating the experiment to biological synapses.
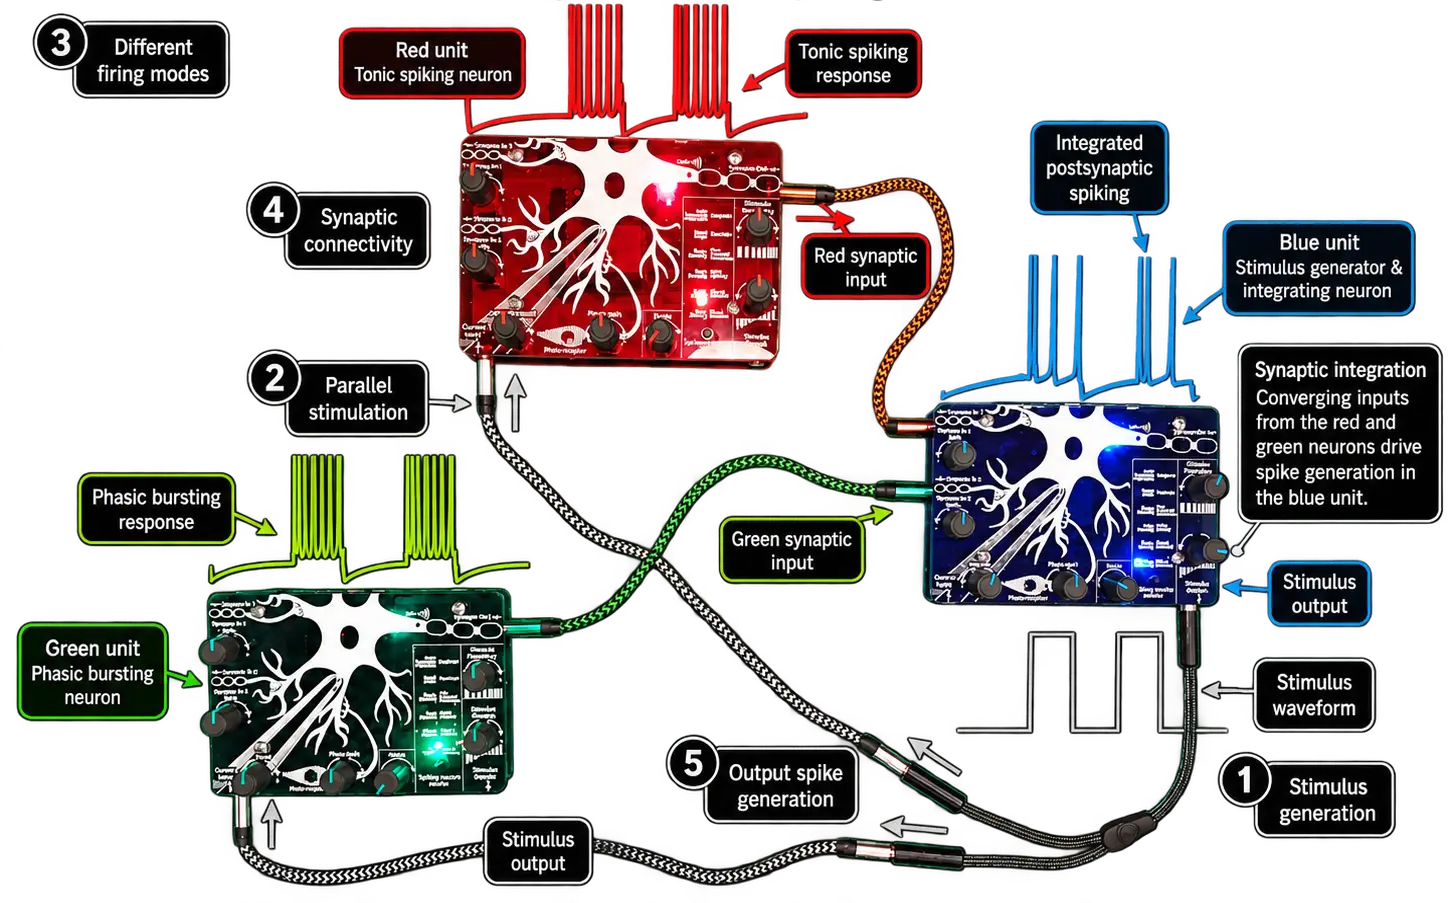
One Spikeling unit (blue) generates a shared stimulus that drives a tonic spiking neuron (red) and a phasic bursting neuron (green).
Their outputs then synapse onto a third unit (blue), demonstrating real-time network connectivity and synaptic integration.
EXPERIMENTAL LOGIC
Across experiments, students change defined variables while keeping other conditions controlled, observe how the neuron responds, repeat protocols and compare outcomes.
This makes it possible to distinguish what was manipulated, what was measured and what can legitimately be inferred from the resulting activity.
By changing defined variables, repeating conditions and comparing responses, students can ask which conclusions are supported by the experiment and which depend on assumptions about the model or measurement.
Recording those responses makes the same reasoning quantitative.
Spikeling therefore provides a way to teach not only neuronal behaviour, but how experimental design determines what can legitimately be concluded from an observation.
RECORDING & ANALYSIS
Spikeling records the signals that define an experiment, not only the membrane-potential trace.
The GUI saves the neuronal response together with stimulus timing, total input current, synaptic signals and event markers, allowing students to reconstruct what was applied and how the neuron responded.
Recorded experiments can then be inspected in the built-in analysis interface, where students can identify spikes, compare signals and work with repeated stimulus epochs before exporting the data for further quantitative analysis.
Recorded experiments can then be inspected in the built-in analysis interface, where students can identify spikes, compare signals and work with repeated stimulus epochs before exporting the data for further quantitative analysis.
A trace is not yet a result.
What matters is how the measurement was obtained, how events were defined and whether the comparison answers the experimental question.
Raw data
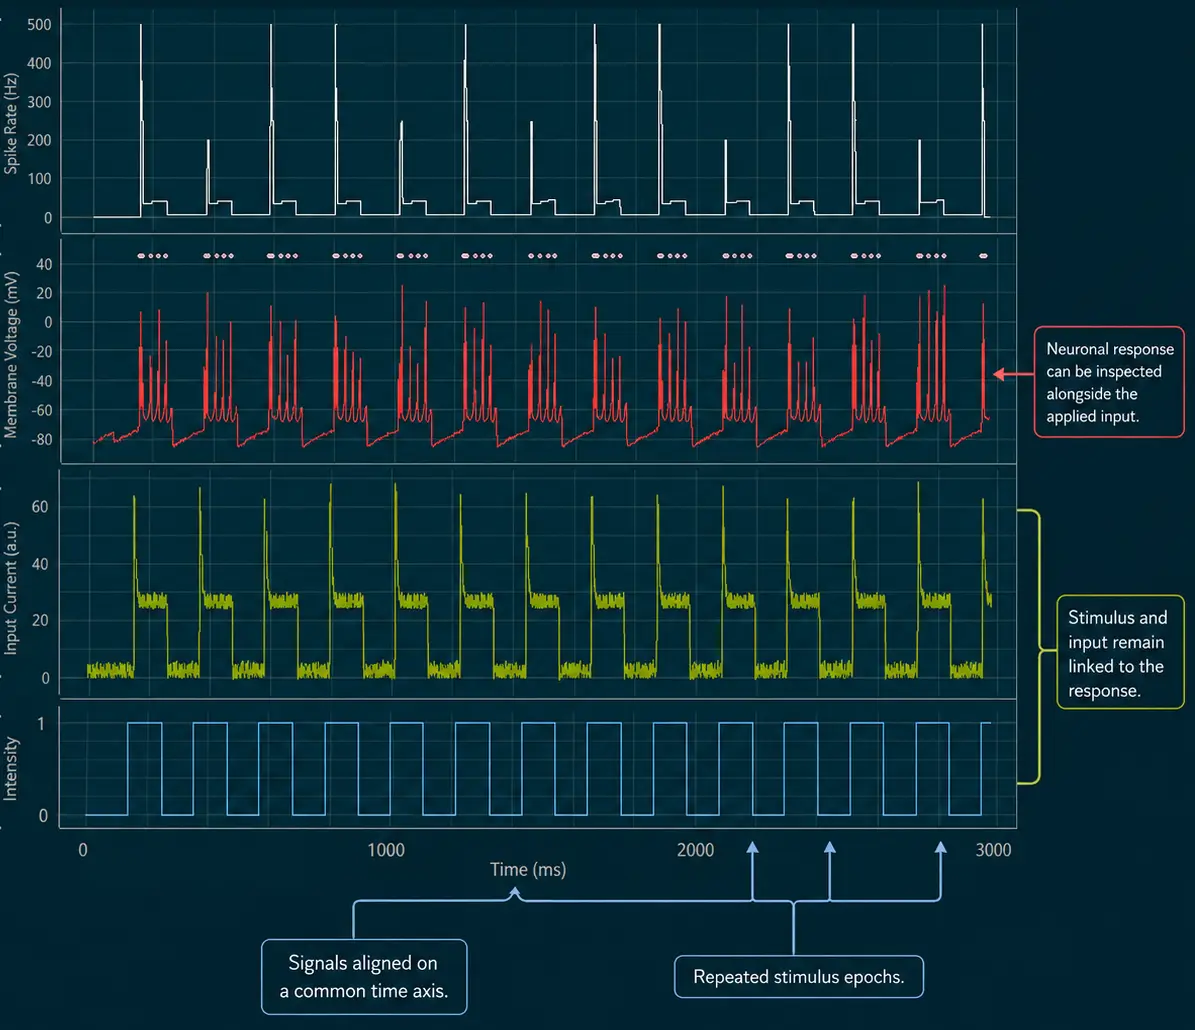
A recorded neuronal response is most informative when it can be viewed alongside the signals that produced it.
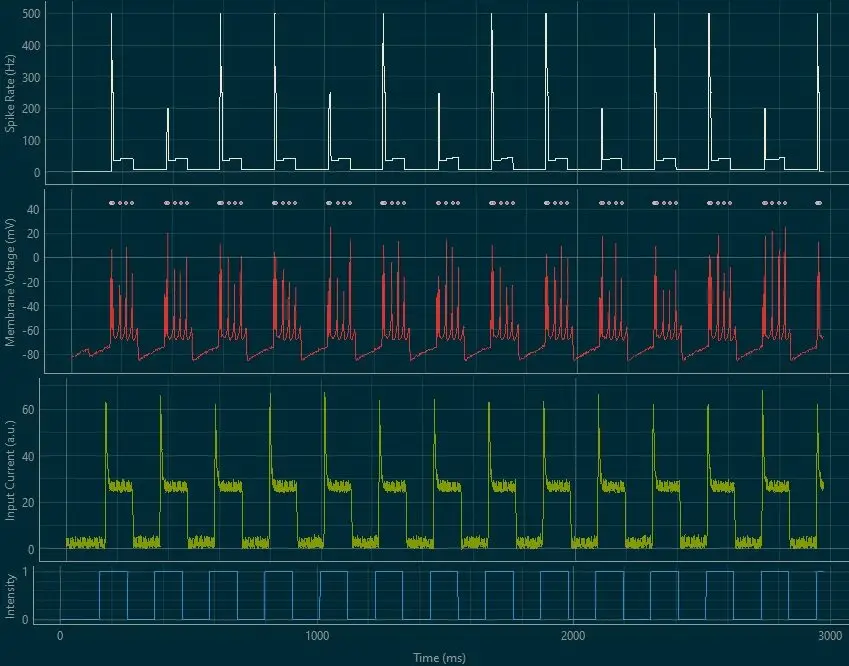
Spikeling's analysis interface lets students reopen an experiment and inspect membrane potential together with stimulus timing, total input current and synaptic activity on a common time axis.
This makes it possible to return to the raw experiment before reducing it to a firing rate or other summary measure: identify baseline and stimulation periods, check when responses occurred, determine which input pathway was active, and compare the timing of manipulation and neuronal response.
The first analytical question is therefore not “what number can I calculate?”, but “what does the recording actually show?”
What students practise
How to read several experimental signals together, identify the relevant epochs of a recording and decide what should be measured before starting quantitative analysis.
Raw data · Signal alignment · Baseline · Input–output relationships · Experimental timing · Quality control
TEACHING SCOPE & LIMITS
These recordings come from the Spikeling computational model and experimental interface, so they are cleaner and more controlled than many biological recordings.
Raw-data inspection can teach signal interpretation, timing and quality control, but does not reproduce the full range of electrode artefacts, drift, biological variability and acquisition problems encountered in research electrophysiology.
EVENT DETECTION & QUANTIFICATION
Once the raw recording has been inspected, the next step is to define which features of the response should be measured.
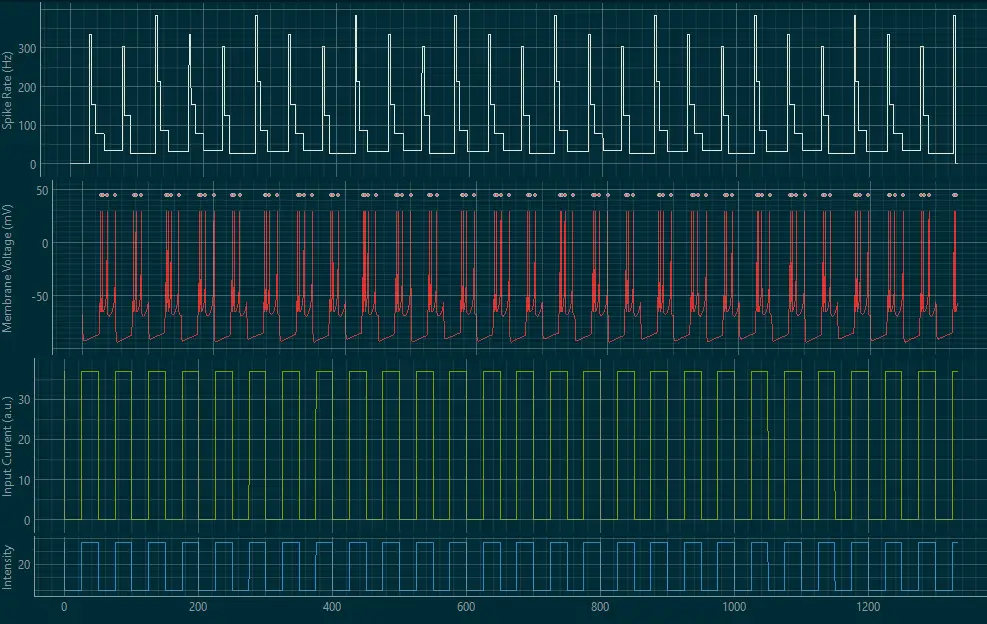
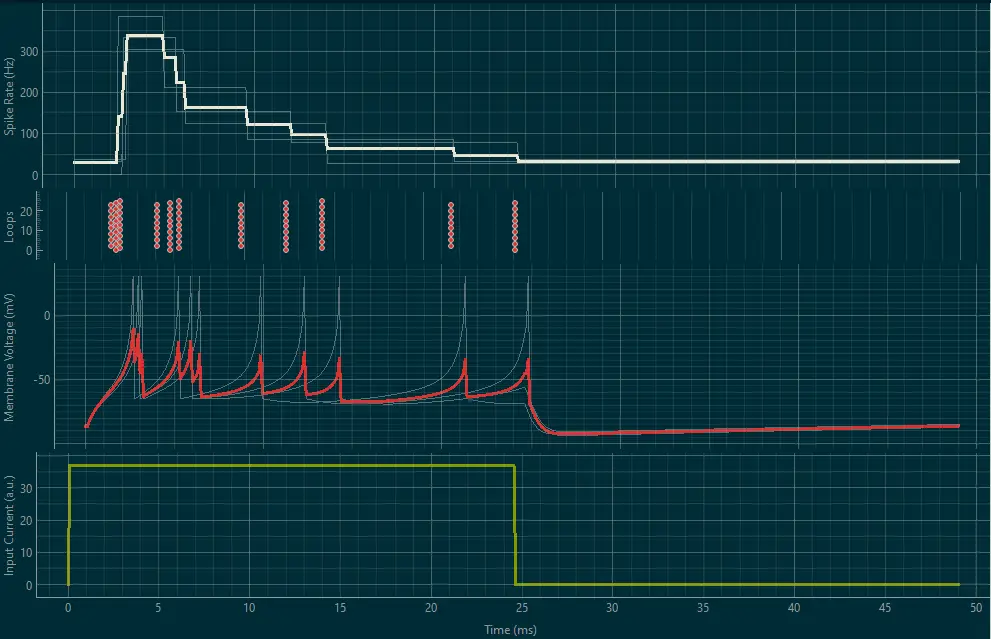
Spikeling GUI can detect action-potential events from the membrane-potential trace using a chosen voltage threshold and transform those events into representations such as spike timing and instantaneous firing rate.
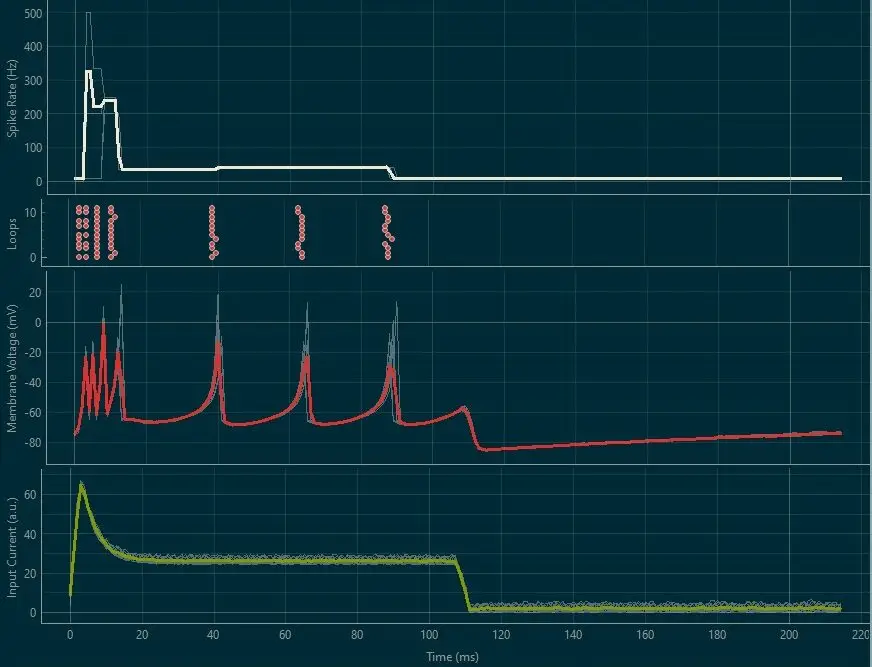
Repeated stimulus epochs can then be aligned using the recorded trigger signal, allowing individual trials to be compared as rasters and overlaid traces before calculating average responses.
This moves students from observing that neuronal activity changes to asking how that change can be quantified consistently across trials and conditions.
Measurement begins with an operational definition: what counts as a spike, a trial or a response must be specified before the result can be compared.
What students practise
How to define measurable events, apply the same analysis criterion across trials and transform repeated neuronal responses into comparable quantitative representations.
Spike detection · Event timing · Firing rate · Trial alignment · Raster plots · Trial averaging
TEACHING SCOPE & LIMITS
The built-in analysis tools are designed to introduce the logic of event detection and repeated-trial comparison rather than replace a full scientific analysis environment.
Threshold-based spike detection, firing-rate estimates and trial averages provide accessible quantitative representations, while more advanced statistical analysis can be carried out after export.
Because analysis choices affect the result, students should compare conditions using consistent criteria and inspect the underlying raw trace when interpreting derived measurements.
OPEN DATA WORKFLOW
Spikeling does not lock experimental data inside the application.
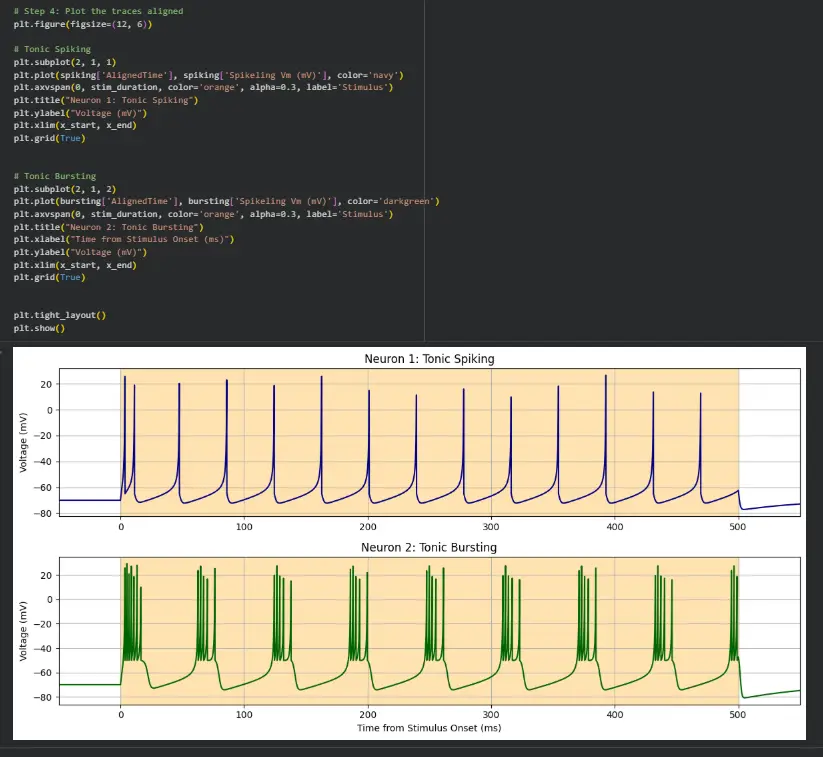
Recordings and derived results can be exported in standard tabular formats, allowing students to continue working with the same experiment outside the GUI.
This creates a natural progression from guided visual analysis to independent quantitative work: students can reproduce plots, calculate their own metrics, compare conditions and develop scripted analyses using the tools appropriate to their course.
A recording can support more than one measurement. The analysis chosen should follow the experimental question rather than the capabilities of the software.
What students practise
How to reuse experimental data outside the acquisition software and develop independent quantitative analyses.
Data export · Reproducibility · Scripted analysis · Quantitative comparison · Open workflows
TEACHING SCOPE & LIMITS
Export makes the data accessible to external analysis, but it does not determine which analysis is scientifically appropriate.
Choice of metrics, preprocessing and statistical methods remains part of the experimental reasoning students are expected to develop.
MEASUREMENT & INTERPRETATION
Recording turns neuronal activity into data, but analysis does not simply reveal a result that was already there.
A membrane-potential trace, detected spike times, firing rate, trial raster and averaged response are different representations of the same experiment, each preserving some information while reducing or emphasising other features.
Choosing how activity is measured and represented is therefore part of the experimental method.
Students can ask not only whether a neuronal response changed, but which features of that response remain visible after detection, alignment, averaging or other analytical transformations.
The same principle becomes even more important when the measurement technique itself changes.
CALCIUM IMAGING SIMULATION
Spikeling extends the same neuronal activity explored electrophysiologically into a simulated calcium-imaging workflow.
Spikes generated by the computational neuron drive a calcium response, which is then transformed into fluorescence, allowing students to compare fast electrical activity with the slower optical signals commonly used in systems neuroscience.
By viewing membrane potential, calcium and fluorescence together, students can examine how an indirect measurement changes the representation of neuronal activity: individual spikes can become delayed and broadened transients, closely spaced events can overlap, and temporal detail can be lost as activity passes through calcium dynamics, indicator kinetics and image sampling.
The imaging interface also provides control over parameters of the simulated measurement, allowing students to distinguish changes originating in the neuron from changes introduced by the way activity is observed.
Because the underlying electrical activity is known, students can compare it directly with the simulated optical readout and identify what the measurement preserves, transforms or obscures.The imaging interface also provides control over parameters of the simulated measurement, allowing students to distinguish changes originating in the neuron from changes introduced by the way activity is observed.
What students investigate
How electrical activity is transformed into calcium and fluorescence signals, which features of spiking remain visible after that transformation, and how measurement parameters constrain interpretation.
Calcium dynamics · Fluorescence · Indicator kinetics · Temporal sampling · ΔF/F · Indirect measurement
TEACHING SCOPE & LIMITS
Spikeling provides a forward simulation of calcium and fluorescence from known neuronal activity.
It teaches the relationship between spikes, calcium dynamics, indicator response, temporal sampling and fluorescence analysis, rather than reproducing a complete biological calcium pathway or microscope acquisition system.
EXTRACELLULAR RECORDING SIMULATION
Spikeling transforms known neuronal spike activity into a simulated multichannel extracellular recording.
Rather than observing membrane potential directly, students can examine how the electrical signature of a spiking neuron appears across the four contacts of a virtual tetrode.
The signal recorded on each contact depends on its spatial relationship to the neuronal source, so the same spike can appear with different amplitudes across channels.
Students can then explore how electrode geometry, noise, interference, referencing and filtering influence the signals ultimately available for detection and interpretation.
Because the underlying neuronal activity is known, extracellular events can be compared directly with their intracellular ground truth.
This provides an accessible route into the logic of multichannel recording, spike detection and the spatial information that makes extracellular unit discrimination possible.
What students investigate
How the same neuronal activity produces different signals across nearby electrode contacts, and how geometry, noise and signal processing affect which extracellular events can be detected and interpreted.
Extracellular potentials · Multichannel recording · Signal-to-noise · Referencing & filtering · Spike detection
TEACHING SCOPE & LIMITS
Spikeling uses a reduced forward model to generate tetrode-style extracellular signals from known neuronal activity.
It is designed to teach how source geometry, multichannel sampling, noise, referencing, filtering and detection influence an extracellular recording.
It does not reproduce a full biophysical extracellular forward solution, detailed neuronal morphology, tissue conductivity or a complete research acquisition and spike-sorting pipeline.
Open by design
Spikeling exposes not only the neuronal model and experimental data, but also the hardware, firmware, software and documentation that make the experiment possible.
Editable hardware design sources, schematics and PCB materials are publicly inspectable. Check the repository for the current bill of materials and assembly resources.
Hardware licence: CERN-OHL-S-2.0
Public source, desktop releases and the project issue tracker provide routes for inspection, development and contribution.
Software and firmware licence: GPL-3.0-or-later
Experiments, technical documentation and developing teaching resources. Instructor-facing materials may still be under development.
Documentation is maintained independently of hardware, firmware and GUI versions.
The documented workflow supports recording, export and downstream inspection of experimental traces and stimulus information.
Verify exact export fields and analysis examples against the current GUI documentation.
Project source files remain publicly inspectable and reusable under their respective licences. Purchasing from OSN provides an assembled unit through the current product listing and a direct route to deployment support. Sales support continued project maintenance, documentation and teaching development.
Use the desktop GUI in emulator mode to explore the experimental workflow.
Inspect the open hardware, design files and available assembly resources.
See the current assembled Spikeling product, availability and up-to-date pricing.
Discuss classroom quantities, onboarding, teaching adaptation or workshop delivery.
Planning a class requires more than a product specification. OSN can provide current platform information, quotations and deployment support before an order is placed.
Spikeling V3
3.2
Repository documentation: v3.1 — confirm against the current source before publication.
v3.1.2
Current web documentation; version tracked independently.
Desktop releases are cross-platform; check the current release assets for supported systems.
Physical hardware and desktop emulator.
Request a current quotation through OSN.
Discuss onboarding, classroom requirements and workshop support.
See the live product listing; availability may change.
Discuss course format, current availability, institutional quotations and the right mix of physical hardware and emulator access.
Request an institutional quote See current pricingNo. It implements a real-time Izhikevich spiking-neuron model and educational experimental interface; it is not a biological preparation or research-grade electrophysiology recorder.
It has a documented university teaching and outreach origin. Activities can be adapted to learner experience and the intended teaching context.
Yes. The desktop GUI includes emulator mode, allowing the software workflow to be explored without a physical Spikeling unit.
The documented workflow supports recording experimental traces and exporting data for further analysis. Confirm the exact export fields and current file formats in the current GUI documentation.
The desktop GUI is distributed as a cross-platform release. Check the current release assets for the operating systems and installer builds currently supported.
There is no single verified student-to-unit ratio. Contact OSN to discuss class size, teaching format and the balance between physical units and emulator access.
Yes. Public experiments and developing teaching resources can be adapted to a course, subject to their applicable licences and the state of each resource.
Yes. The public hardware design files and supporting technical resources can be inspected and reused under the applicable open-hardware licence.
The hardware is released under CERN-OHL-S-2.0. Software and firmware are released under GPL-3.0-or-later; consult the repository licence files for the applicable terms.
OSN offers routes to discuss assembled units, institutional quotations, classroom deployment and workshop adaptation. Confirm specific procurement or support arrangements directly.